


 Чуй новините
 Подкаст
ИЗВЕСТИЯ
Моите новини
Първият от очакваните до 8 американски самолета цистерни...
Чете се за: 01:10 мин.

Работната група продължава работата по избора на град...
Чете се за: 00:22 мин.
Изплащането на пенсиите започва на 7 август
Чете се за: 01:22 мин.

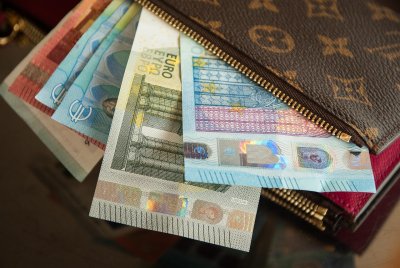
ЕК преведе на България близо 900 милиона евро по ПВУ
Чете се за: 03:12 мин.
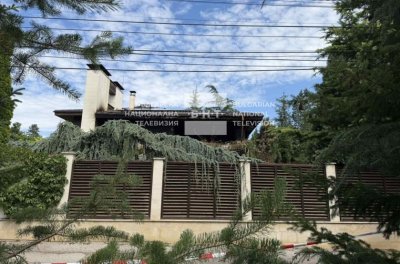
Демерджиев: Има заподозрени за убийството на бизнесмена...
Чете се за: 01:45 мин.
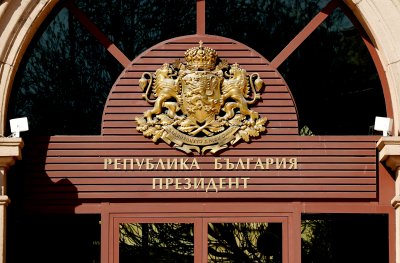
Народното събрание определи датата на президентските избори
Чете се за: 01:25 мин.

Пълно разоръжаване: Съветът за мир постигна споразумение...
Чете се за: 02:37 мин.

ЦСКА продължава в квалификациите на Лига Европа след...
Чете се за: 02:37 мин.